Matplotlibのグラフのスタイルを設定ファイル・スタイルシートで変更
Matplotlibの設定ファイルmatplotlibrcの使い方
Matplotlibのデフォルトのグラフのスタイル(線やグリッドの種類・太さ・色など)はmatplotlibrcという設定ファイルで規定される。
常に適用したい設定はmatplotlibrcに記述する。
matplotlibrcを置く場所
matplotlibrcの置き場所は3箇所ある。以下の順番で検索され、見つかり次第そのファイルの設定が適用される。
- プロジェクトのカレントディレクトリ(作業フォルダ)
- そのプロジェクトにだけ設定を適用したい場合、ここに置く
- Matplotlib設定保存用ディレクトリ
- 各OSでの場所は以下の通り(環境によっては違う場合もある)
- Linuxの場合、
.config/matplotlib/ - Macの場合、
/Users/<user-name>/.matplotlib/ - Windowsの場合、
C:\\Documents and Settings\\<user-name>\\.matplotlib
- Linuxの場合、
- 各OSでの場所は以下の通り(環境によっては違う場合もある)
- Matplotlibのインストールディレクトリ直下の
mpl-data
Matplotlib設定保存用ディレクトリはメソッドget_configdir()で確認できる。
import matplotlib as mpl

print(mpl.get_configdir())
現在適用されているmatplotlibrcの確認方法
実際にどのmatplotlibrcが適用されているかは、メソッドmatplotlib_fname()で確認できる。プロジェクトのカレントディレクトリやMatplotlib設定保存用ディレクトリにmatplotlibrcを置いたつもりなのにスタイルが変わらない場合は、このメソッドで確認するといい。
print(mpl.matplotlib_fname())
また、matplotlibrcはmatplotlibをimportするタイミングで読み込まれるため、Jupyter Notebookの場合、途中でmatplotlibrcを変更してもスタイルは変わらない。Kernel > Restart & Clear Outputで再起動して最初から再実行するとOK。
matplotlibrcの書き方
Matplotlibのインストールディレクトリ直下のmpl-dataにあるmatplotlibrcに設定項目とその書き方がコメントで列挙されている。
線についての設定は以下のようになっている。
### LINES
# See http://matplotlib.org/api/artist_api.html#module-matplotlib.lines for more
# information on line properties.
#lines.linewidth   : 1.5     # line width in points
#lines.linestyle   : -       # solid line
#lines.color       : C0      # has no affect on plot(); see axes.prop_cycle
#lines.marker      : None    # the default marker
#lines.markeredgewidth  : 1.0     # the line width around the marker symbol
#lines.markersize  : 6            # markersize, in points
#lines.dash_joinstyle : miter        # miter|round|bevel
#lines.dash_capstyle : butt          # butt|round|projecting
#lines.solid_joinstyle : miter       # miter|round|bevel
#lines.solid_capstyle : projecting   # butt|round|projecting
#lines.antialiased : True         # render lines in antialiased (no jaggies)

# The three standard dash patterns.  These are scaled by the linewidth.
#lines.dashed_pattern : 2.8, 1.2
#lines.dashdot_pattern : 4.8, 1.2, 0.8, 1.2
#lines.dotted_pattern : 1.1, 1.1
#lines.scale_dashes : True
ここから必要な部分を抜き出して設定すればよい。
例えば、線の太さ・種類・色を変えたい場合は、以下のように設定する。なお、デフォルトのmatplotlibrcのコメントにあるように、lines.colorはplot()には影響しないので、plot()での線の色を変えたい場合はaxes.prop_cycleで設定する。
lines.linewidth   : 3.0
lines.linestyle   : --    # 破線
axes.prop_cycle   : cycler('color', ['green'])
axes.grid         : True
スタイルシートの使い方
Matplotlib1.4以降はスタイルシートファイルを使ってグラフのスタイルを簡単に変更できる。
スタイルシートの適用はコード内で指定する必要があるので、常に適用したい設定は前述のmatplotlibrcに記述する。
利用できるスタイルシートの確認
plt.style.availableで現在利用できるスタイルシートの一覧を確認できる。seabornをインストールしていると、seabornのスタイルシートファイルも追加されている。
import matplotlib.pyplot as plt

print(plt.style.available)
# ['seaborn-dark', 'seaborn-darkgrid', 'seaborn-ticks', 'fivethirtyeight',
#  'seaborn-whitegrid', 'classic', 'seaborn-talk', 'seaborn-dark-palette',
#  'seaborn-bright', 'seaborn-pastel', 'grayscale', 'seaborn-notebook',
#  'ggplot', 'seaborn-colorblind', 'seaborn-muted', 'seaborn', 'seaborn-paper',
#  'bmh', 'seaborn-white', 'dark_background', 'seaborn-poster', 'seaborn-deep']
スタイルシートの適用
plt.style.use('ggplot')のようにスタイルシートの名前を指定するとそのスタイルが適用される。
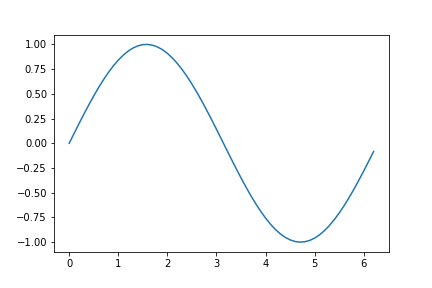
スタイルシートを何も指定しない、デフォルトのスタイルがこれ。
x = np.arange(0, 2 * np.pi, 0.1)
y = np.sin(x)

plt.plot(x, y)
plt.savefig('data/dst/matplotlib_style_default.png')
plt.show()
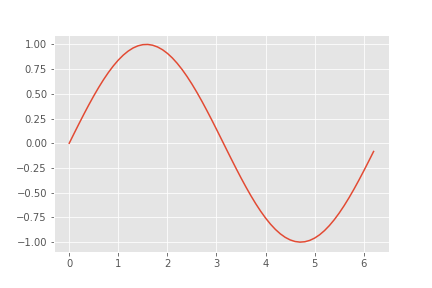
'ggplot'を適用するとこんな感じ。
plt.style.use('ggplot')
plt.plot(x, y)
plt.savefig('data/dst/matplotlib_style_ggplot.png')
plt.show()
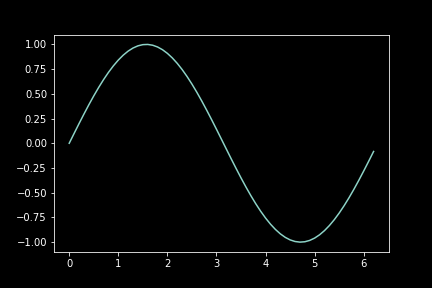
一時的に適用
withブロックでplt.style.context('ggplot')のようにして指定すると、スタイルシートを一時的に適用できる。この場合、withブロックの外には影響を及ぼさない。
with plt.style.context('dark_background'):
    plt.plot(x, y)
    plt.savefig('data/dst/matplotlib_style_dark_background.png')
    plt.show()
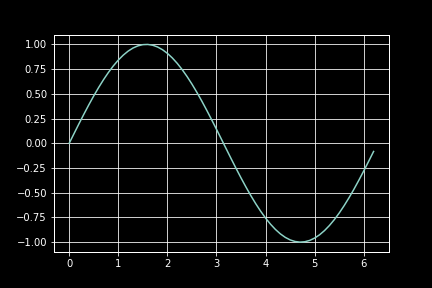
複数のスタイルシートを組み合わせて適用
複数のスタイルシートをリストで指定することもできる。設定が競合した場合は後に指定したほうで上書きされる。
with plt.style.context(['ggplot', 'dark_background']):
    plt.plot(x, y)
    plt.savefig('data/dst/matplotlib_style_ggplot_dark_background.png')
    plt.show()
スタイルシートの自作
スタイルシートを独自に作成することもできる。書き方は前述のmatplotlibrcと同じ。
前述のMatplotlib設定保存用ディレクトリにstylelibというディレクトリを作って、作成したファイルを<style-name>.mplstyleという名前で保存すると、plt.style.use('<style-name>')で使用可能。
Matplotlib設定保存用ディレクトリはメソッドmpl.get_configdir()で確認できる。
import matplotlib as mpl

print(mpl.get_configdir())
なお、デフォルトのスタイルシートファイルはMatplotlibのインストールディレクトリ直下のmpl-data/stylelibディレクトリに格納されている。書き方の参考になる。
自作のスタイルシートは、任意の場所に作成してパスで指定することもできる。
以下のようなファイルを作成。
lines.linewidth   : 3.0
lines.linestyle   : --    # 破線
axes.prop_cycle   : cycler('color', ['green'])
axes.grid         : True
パスで指定して適用。
with plt.style.context('data/src/test.mplstyle'):
    plt.plot(x, y)
    plt.savefig('data/dst/matplotlib_style_test.png')
    plt.show()

例えば、複数のスタイルシートを指定する際に自作のファイルを用いれば、既存のスタイルシートの一部だけ上書きして変更できる。便利。
with plt.style.context(['ggplot', 'data/src/test.mplstyle']):
    plt.plot(x, y)
    plt.savefig('data/dst/matplotlib_style_test_ggplot.png')
    plt.show()
