Matplotlibのmplot3dで3Dグラフを作成
Posted: | Tags: Python, Matplotlib
matplotlibは3Dのグラフも作成できる。mplot3dを使う。
公式のチュートリアル、例が参考になる。
- mplot3d tutorial — Matplotlib 1.5.0 documentation
- matplotlib/examples/mplot3d at master · matplotlib/matplotlib
二次元のガウス分布を可視化
平均を0、分散を $\sigma^2$とすると、二次元のガウス分布は、
$$ h_g (x,y) = \frac{1}{2\pi\sigma^2}\exp \Bigl( -\frac{x^2+y^2}{2\sigma^2} \Bigr) $$
となる。これをグラフにしてみる。
なお、ここで挙げる種類以外のグラフもあるので、詳細は公式のチュートリアル参照。
import numpy as np
import matplotlib.pyplot as plt
from mpl_toolkits.mplot3d import axes3d
from matplotlib import cm
fig = plt.figure()
ax = fig.add_subplot(111, projection='3d')
x = y = np.arange(-15, 15, 0.5)
X, Y = np.meshgrid(x, y)
sigma = 4
Z = np.exp(-(X**2 + Y**2)/(2*sigma**2)) / (2*np.pi*sigma**2)
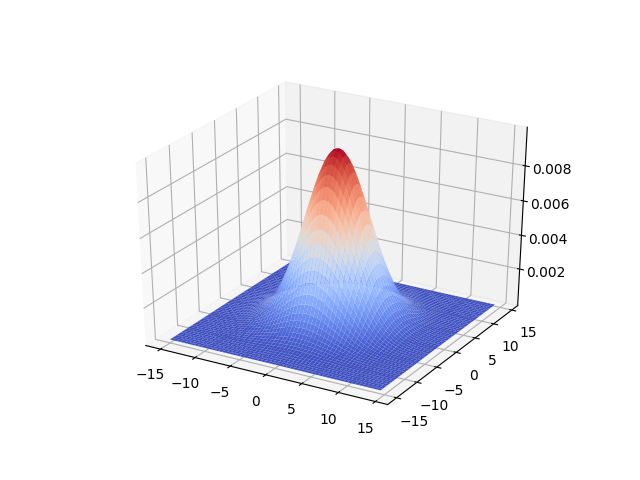
ax.plot_surface(X, Y, Z, rstride=1, cstride=1, cmap=cm.coolwarm)
plt.savefig("data/dst/matplotlib_mplot3d_surface.png")
ax.clear()
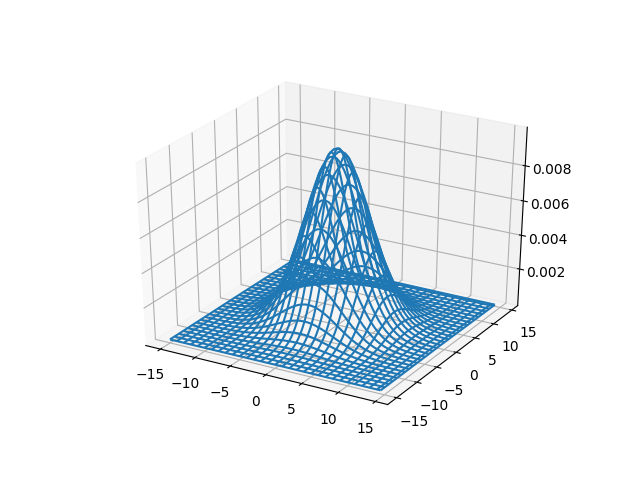
ax.plot_wireframe(X, Y, Z, rstride=2, cstride=2)
plt.savefig("data/dst/matplotlib_mplot3d_wireframe.png")
ax.clear()
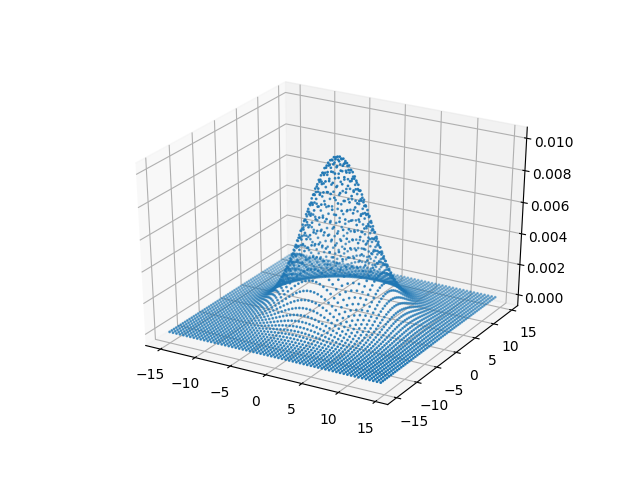
ax.scatter(X, Y, Z, s=1)
plt.savefig("data/dst/matplotlib_mplot3d_scatter.png")
source: matplotlib_mplot3d.py
Surface plots
Wireframe plots
Scatter plots
注意点
matplotlibのバージョンが1.0.0以前の場合は書き方が異なるので注意。
Prior to version 1.0.0, the method of creating a 3D axes was different. For those using older versions of matplotlib, change ax = fig.add_subplot(111, projection='3d') to ax = Axes3D(fig). mplot3d tutorial — Matplotlib 1.5.0 documentation
ax = fig.add_subplot(111, projection='3d')
# ver 1.0.0以前の場合は次のように書く
# ax = axes3d(fig)