seabornでMatplotlibの見た目を良くする
seabornはmatplotlibベースの統計データビジュアライゼーションライブラリ。
Seaborn is a Python visualization library based on matplotlib. seaborn: statistical data visualization — seaborn 0.6.0 documentation
statisticalと銘打っているだけあって、統計的なデータをプロットするための機能がたくさん用意されているが、普通の折れ線グラフの見た目を良くするためだけにも使える。
スタイルを変える
import seaborn as snsでimportする。
import numpy as np
import matplotlib.pyplot as plt
import seaborn as sns
sns.set()
sns.set_style("whitegrid", {'grid.linestyle': '--'})
sns.set_context("paper", 1.5, {"lines.linewidth": 4})
sns.set_palette("winter_r", 8, 1)
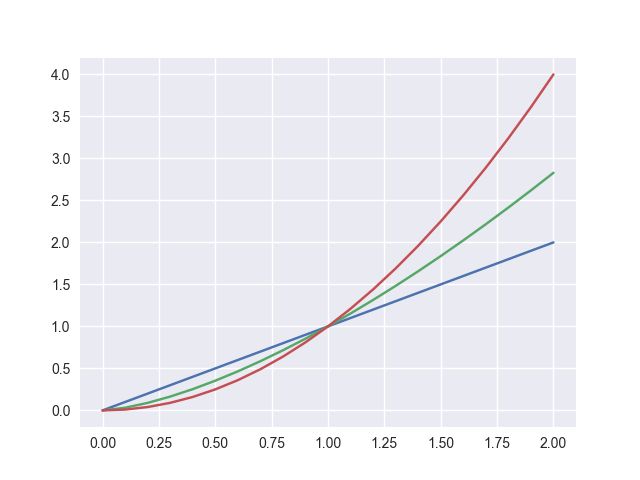
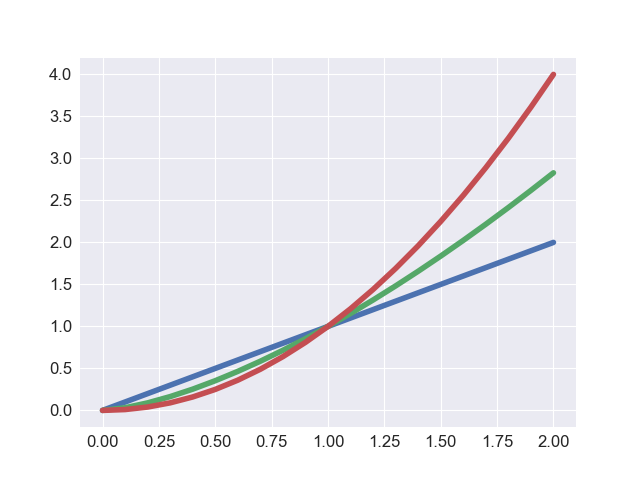
sns.set('talk', 'whitegrid', 'dark', font_scale=1.5,
rc={"lines.linewidth": 2, 'grid.linestyle': '--'})
x = np.arange(0, 2.1, 0.1)
plt.plot(x, x)
plt.plot(x, x**1.5)
plt.plot(x, x**2)
plt.savefig('data/dst/matplotlib_seaborn_set_all.png')
sns.set()でseabornのデフォルトスタイルが適用される。特にこだわりがなければ、これだけでイイ感じのデザインになる。
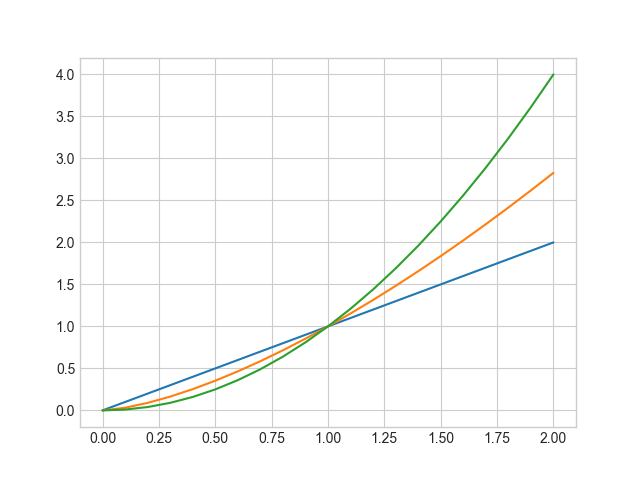
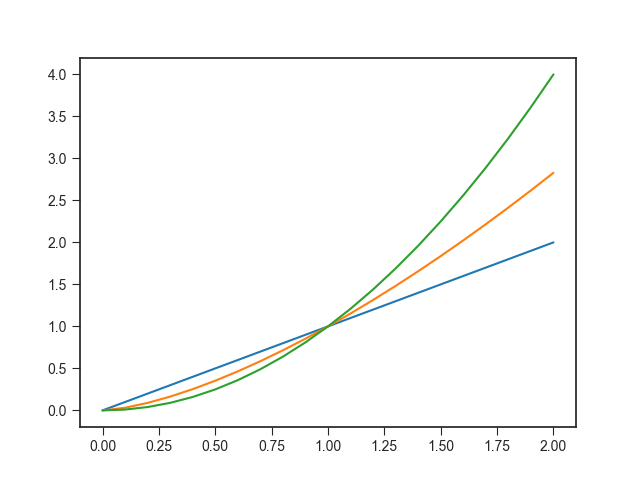
sns.set_style()でスタイルを変更できる。
seaborn.set_style(style=None, rc=None) seaborn.set_style — seaborn 0.6.0 documentation
プリセットのstyleは5つ。
darkgrid:背景暗、グリッドあり。デフォルト。dark:背景暗、グリッドなし。whitegrid:背景白、グリッドあり。white:背景白、グリッドなし。ticks:背景白、軸にのみグリッドあり。
sns.set_style('whitegrid')のように設定する。
whitegridとticks。
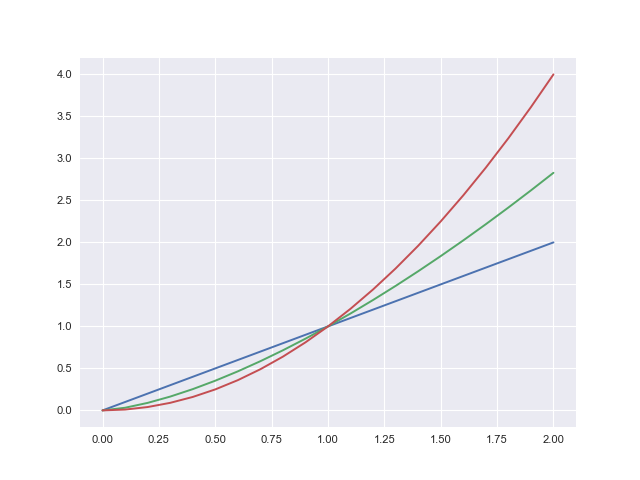
引数rcで、さらに細かい設定もできる。例えば、グリッドの線を破線にするには、
sns.set_style("whitegrid", {'grid.linestyle': '--'})
と設定する。
そのほか設定できる項目は公式のチュートリアルか、matplotlibの設定サンプル参照。
大きさ(スケール)を変える
sns.set_context()で大きさを変更できる。
seaborn.set_context(context=None, font_scale=1, rc=None) seaborn.set_context — seaborn 0.6.0 documentation
プリセットのcontextは4つ。下にいくほど大きくなる。
papernotebook(デフォルト)talkposter
sns.set_context("paper")のように設定する。
paperとposter。

引数font_scaleとrcで、さらに細かい設定もできる。例えば、フォントを大きく、線を太くするには、
sns.set_context("paper", 2.5, {"lines.linewidth": 4})
と設定する。
色を変える
sns.set_palette()で色を変更できる。
seaborn.set_palette(palette, n_colors=None, desat=None, color_codes=False) seaborn.set_palette — seaborn 0.6.0 documentation
paletteには、
- matplotlibのカラーマップ
- seabornのカラーパレット(
deep,muted,pastel,bright,dark,colorblind) hlshusl
のいずれかを設定する。
名前付きのパレットはデフォルトで6色なので、それ以上使いたい場合は、引数n_colorsで色数を設定する。ただし、seabornのカラーパレットは6色までしか用意されていない。
matplotlibのカラーパレットwinterを8色で使う場合、
sns.set_palette("winter", 8)
と設定する。
引数desatを使うと彩度を下げることが出来る。彩度を半分にする場合、
sns.set_palette("winter", 8, 0.5)
と設定する。
desat=1(設定なし)とdesat=0.5。分かりやすいようにプロットの本数も増やしている。
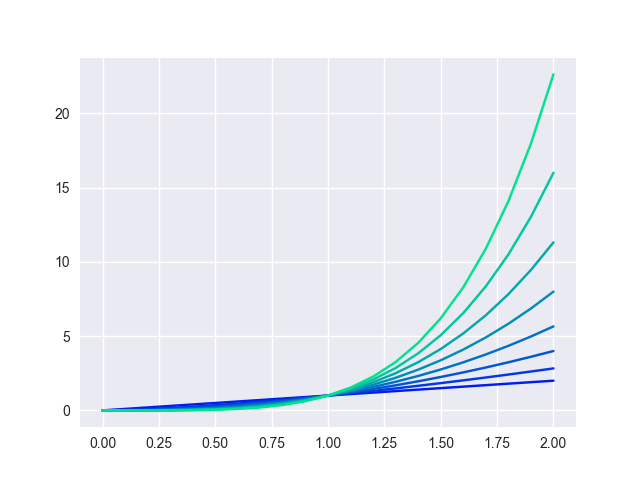

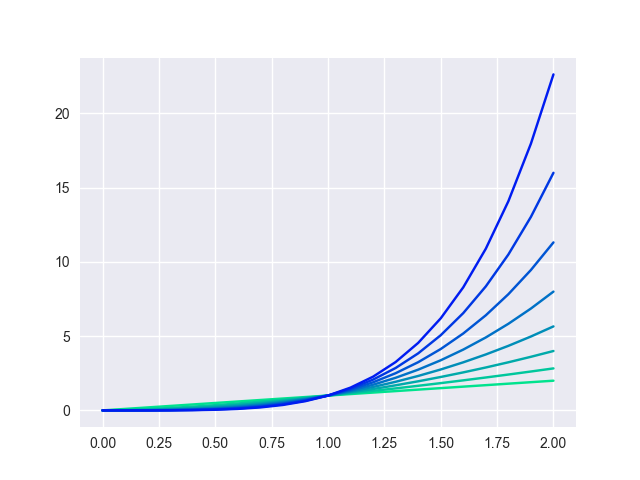
Matplotlibのカラーパレットを使う場合、paletteの名前に_rを付けると色の順番が逆になる。
sns.set_palette("winter_r", 8)
winterとwinter_r。
まとめて変える
sns.set()でスタイルや色をまとめて変更できる。
seaborn.set(context='notebook', style='darkgrid', palette='deep', font='sans-serif', font_scale=1, color_codes=False, rc=None) seaborn.set — seaborn 0.6.0 documentation
一気に設定できる。
sns.set('talk', 'whitegrid', 'dark', font_scale=1.5,
        rc={"lines.linewidth": 2, 'grid.linestyle': '--'})
