Draw circle, rectangle, line, etc. with Python, Pillow
ImageDraw module of the Python image processing library Pillow (PIL) provides many methods for drawing figures, such as circles, squares, and straight lines.
This article describes the following contents.
- Flow of drawing figures
- Drawing method
- Common parameters
- Method example
- Draw on the existing image
See the following article for the installation and basic usage of Pillow (PIL).
Flow of drawing figures
Create Draw Object
Prepare an Image object of a background image (image for drawing a figure) and use it to create a Draw object. Don't forget to import Image and ImageDraw.
from PIL import Image, ImageDraw

im = Image.new('RGB', (500, 300), (128, 128, 128))
draw = ImageDraw.Draw(im)
Here, create a solid image with Image.new(). The mode, size, and fill color are specified in parameters.
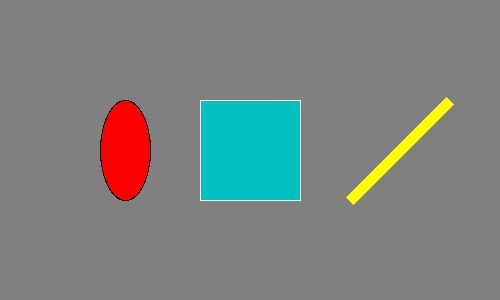
Draw a shape with the drawing method
Call the drawing method from the Draw object to draw a figure.
Draw an ellipse, a rectangle, and a straight line as an example. The parameters will be described later.
draw.ellipse((100, 100, 150, 200), fill=(255, 0, 0), outline=(0, 0, 0))
draw.rectangle((200, 100, 300, 200), fill=(0, 192, 192), outline=(255, 255, 255))
draw.line((350, 200, 450, 100), fill=(255, 255, 0), width=10)

im.save('data/dst/pillow_imagedraw.jpg', quality=95)
Drawing method
Common parameters
The following parameters are commonly used in many methods.
xy
Set a rectangular area to draw a figure.
Specify in one of the following formats:
(((Upper left x coordinate, upper left y coordinate), (lower right x coordinate, lower right y coordinate))(Upper left x coordinate, upper left y coordinate, lower right x coordinate, lower right y coordinate)
In line(), polygon(), and point(), multiple coordinates are specified instead of two points representing a rectangular area.
(x1, y1, x2, y2, x3, y3...)((x1, y1), (x2, y2), (x3, y3)...)
line() draws a straight line connecting each point, polygon() draws a polygon where each point is connected, and point() draws a point of 1 pixel at each point.
fill
Set the color to fill the shape.
The specification format differs depending on the mode of the image (Image object).
RGB: Set each color value (0-255) in the form of(R, G, B)L(Grayscale): Set a value (0-255) as an integer
The default is None (no fill).
outline
Set the border color of the figure.
The specification format of color is the same as fill above. The default is None (no border).
As of version 4.4.0, there is no option to set the line width (line thickness) other than line().
Method example
See the official document for details.
Ellipse, rectangle
- Ellipse (Circle):
ellipse(xy, fill, outline) - Rectangle (Square):
rectangle(xy, fill, outline)
ellipse() draws an ellipse tangent to the rectangular area specified by the argument xy. If you specify a square, a true circle is drawn.
The output results are as shown in the above example.
Line, polygon, point
- Line:
line(xy, fill, width)xy- Set multiple coordinates of two or more points as
((x1, y1), (x2, y2), (x3, y3)...). - Lines connecting each point are drawn.
- Set multiple coordinates of two or more points as
width: Line width (line thickness)- Note that if you make the line width thicker with
width, specifying 3 points or more withxywill make the connection look unattractive.
- Note that if you make the line width thicker with
- Polygon:
polygon(xy, fill, outline)xy- Set multiple coordinates of three or more points as
((x1, y1), (x2, y2), (x3, y3)...). - A polygon in which each point is connected is drawn.
- Set multiple coordinates of three or more points as
- Point:
point(xy, fill)xy- Set multiple coordinates of one or more points as
((x1, y1), (x2, y2), (x3, y3)...). - One pixel point is drawn for each point.
- Set multiple coordinates of one or more points as
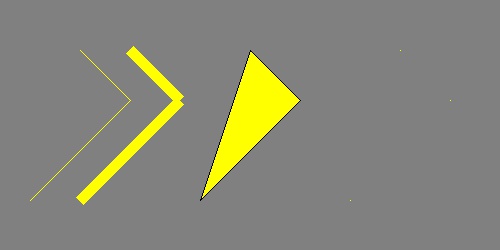
The example of lines (line()), polygon (polygon()), point (point()) is as follows. Since the point is 1 pixel, it is hard to see, but it is drawn on the right side.
im = Image.new('RGB', (500, 250), (128, 128, 128))
draw = ImageDraw.Draw(im)

draw.line(((30, 200), (130, 100), (80, 50)), fill=(255, 255, 0))
draw.line(((80, 200), (180, 100), (130, 50)), fill=(255, 255, 0), width=10)
draw.polygon(((200, 200), (300, 100), (250, 50)), fill=(255, 255, 0), outline=(0, 0, 0))
draw.point(((350, 200), (450, 100), (400, 50)), fill=(255, 255, 0))
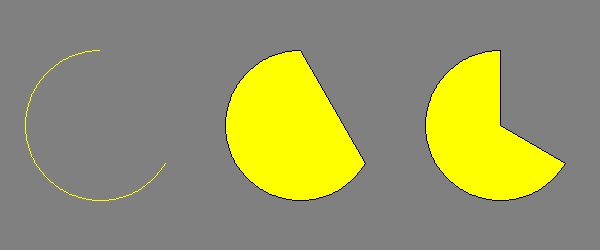
Arc, chord, pie
An arc, a chord (bow), and a pie touching the rectangular area specified by the argument xy are drawn.
- Arc:
arc(xy, start, end, fill)start,end- Set the angle of the arc in degrees.
- 0 degrees is the direction of 3 o'clock. clockwise.
- Chord (bow):
chord(xy, start, end, fill, outline)- The start and end points of the arc are connected by a straight line.
- Pie:
pieslice(xy, start, end, fill, outline)- The start and end points of the arc are connected by a straight line to the center of the circle.
Example of arc (arc()), chord (chord()), pie (pieslice()) is as follows.
im = Image.new('RGB', (600, 250), (128, 128, 128))
draw = ImageDraw.Draw(im)

draw.arc((25, 50, 175, 200), start=30, end=270, fill=(255, 255, 0))
draw.chord((225, 50, 375, 200), start=30, end=270, fill=(255, 255, 0), outline=(0, 0, 0))
draw.pieslice((425, 50, 575, 200), start=30, end=270, fill=(255, 255, 0), outline=(0, 0, 0))
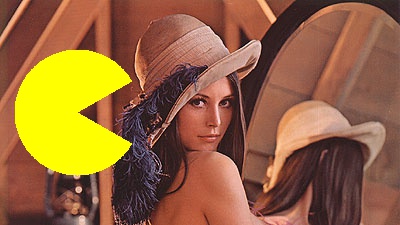
Draw on the existing image
In the previous examples, figures are drawn on the solid image generated by Image.new(). If an existing image file is read by Image.open(), it can be drawn on it.
im = Image.open('data/src/lena.jpg')
draw = ImageDraw.Draw(im)

draw.pieslice((15, 50, 140, 175), start=30, end=330, fill=(255, 255, 0))